NIFTY Technical Analysis Report – 15-03-2020
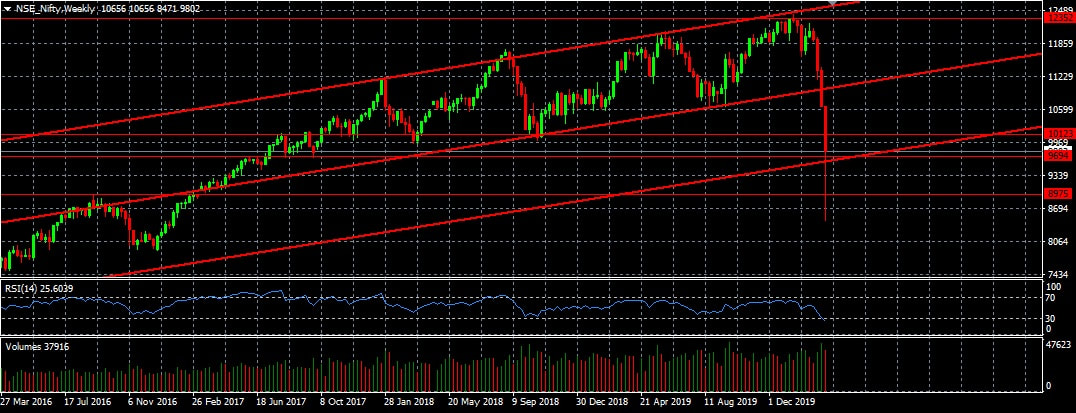
Weekly Chart (9802)
This is Nifty weekly chart and in this chart we can observe that there is a sharp correction in its prices. Nifty is trading near its two and half year low. As per Technical Analysis, 14 day RSI is below 30 indicating Nifty in the oversold zone and from this we can expect some pull back from its current levels. Nifty is trading near its strong support of 9694 and near the bottom of its upward channel. We can also notice the strong pull back of its prices on last Friday to remain within the channel. By this trading behavior we are expecting Nifty to appreciate from its current levels.
Nifty is current trading near its support of 9694 and in the next few days we are expecting Nifty to appreciate from its current levels to 11152 levels and we can expect some buying opportunity around 9694 levels. And again we can expect some resistance around 11152 levels. As per technical analysis we are also expecting Nifty to holds strong support near 8975 levels but any such buying opportunity may only be utilized for short term or intraday trading. And any selling opportunity below 9540 levels may only be used for short term or intraday trading. But fall below 8975 level and if Nifty holds below that level on daily chart then we may expect some further sharp downfall in Nifty prices. And if that happens then we may have to be prepared to deal with some serious economic distress. Currently we are already in for it and we are dealing with it. And that’s the reason we are having sharp correction in the market. Higher volatility is expected in the market index and breakouts of support or resistance levels may trigger further movement in the same direction to its next support or resistance level.
Major Support and Resistance:
Resistance: 10065, 10574, 11152, 11731, 12352, 12694
Support: 9694, 9540, 8975, 8522, 7935, 7070, 6970
Trading with proper stop loss (may be in between 50-70 points) depending upon the volatility will limit the trade risk exposure. Any trigger of stop indicates further revision of strategies as stop loss trigger can drag the prices further in the same direction of stop loss or a change in price direction. So one should be careful and should watch the prices for some time before taking any decision on such events.

 RSS Feed
