USDCAD Technical Analysis Report for the Week Ahead – 10/12/2017
Daily Chart (1.2848)
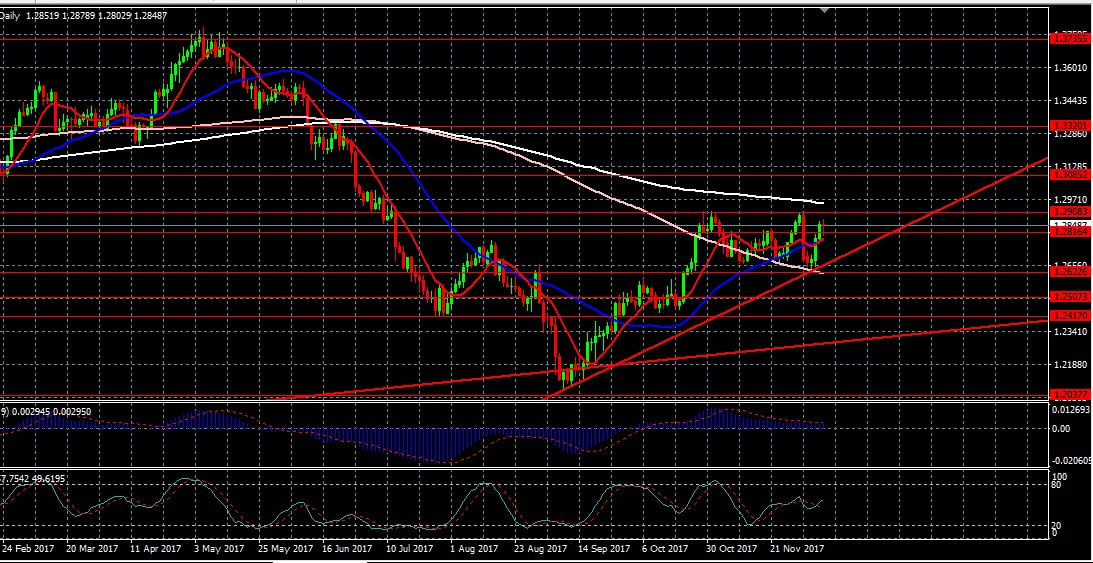
As per the daily chart of USDCAD, we can notice that the currency pair was moving in the upward direction and currently range bound. As per the price movement and technical indicators, we are expecting this currency pair to appreciate further from its current levels. The currency pair is also moving in line with our previous reports. The pair got supports at 1.2816, 1.2698 and 1.2621 levels and resistance at 1.2908, 1.2955 and 1.3008 levels.
So the strategy for trading this pair should be buying at support levels and covering the positions near its resistance levels. Breakout of support or resistance levels will trigger further movement in the same direction.
Major Support and Resistance:
Resistance: 1.2908, 1.2955, 1.3008, 1.3085, 1.3320, 1.3530
Support: 1.2816, 1.2698, 1.2621, 1.2507, 1.2461, 1.2417, 1.2321
As per the technical analysis our strategy for the next few days should be:
Buying USDCAD at its nearest support and selling near 1.2955 with a stop-loss of 35 pips and targets should be near its support and resistance levels. And if stop-loss triggers then the position should be reversed again with a 35 pips stop-loss.


 RSS Feed
