Dow Jones Technical Analysis Report – 15-03-2020
Weekly Chart (23092)
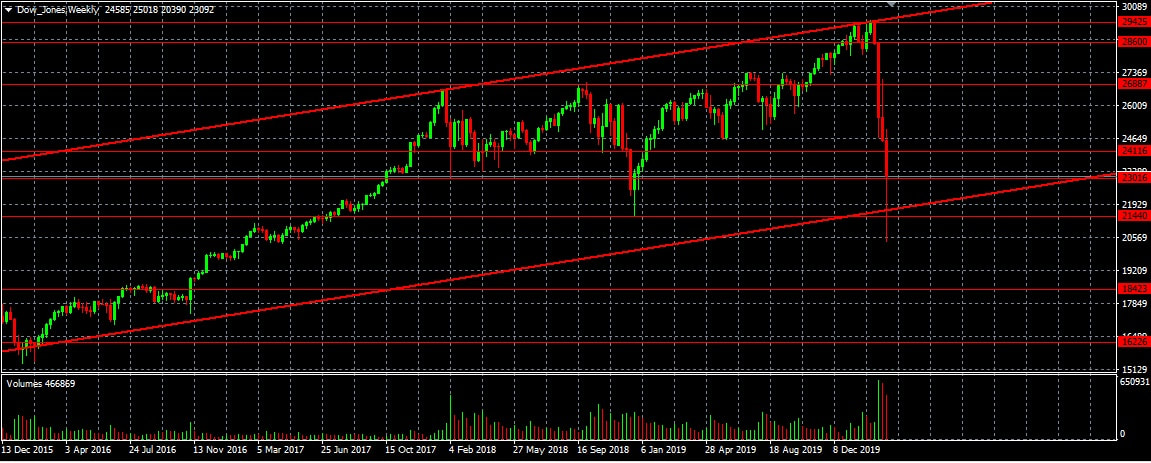
As per the Dow Jones weekly chart, we can notice that the index is moving within the upward channel. Currently Dow is trading near its support of 23016. We are expecting Dow to appreciate and bounce back from 21640 and 21440. Any further drop in prices near to 21640 and 21440 levels may create buying opportunities. And any fall and close below 21440 on weekly chart may trigger further selling pressure. So as per Technical Analysis, the ideal trading strategy for Dow Jones may be buying around 21440 levels and selling around 26887 and 27366 levels. We are expecting Dow Jones to have strong resistance around those levels and break above those levels may trigger further upward movement.
Major Support and Resistance:
Resistance: 24116, 25389, 26887, 27366, 28600, 29425, 30042
Support: 23016, 21440, 18423, 16226, 14323
Trading with proper stop loss (may be around 50 points) is a must to limit the trade risk exposure. Any trigger of stop indicates further revision of strategies as stop loss trigger can drag the prices further in the same direction of stop loss or a change in price direction. So one should be careful and should watch the prices for some time before taking any decision on such events.
 RSS Feed
