BTCUSD Technical Analysis Report – 15-03-2020
Weekly Chart (5329.03)
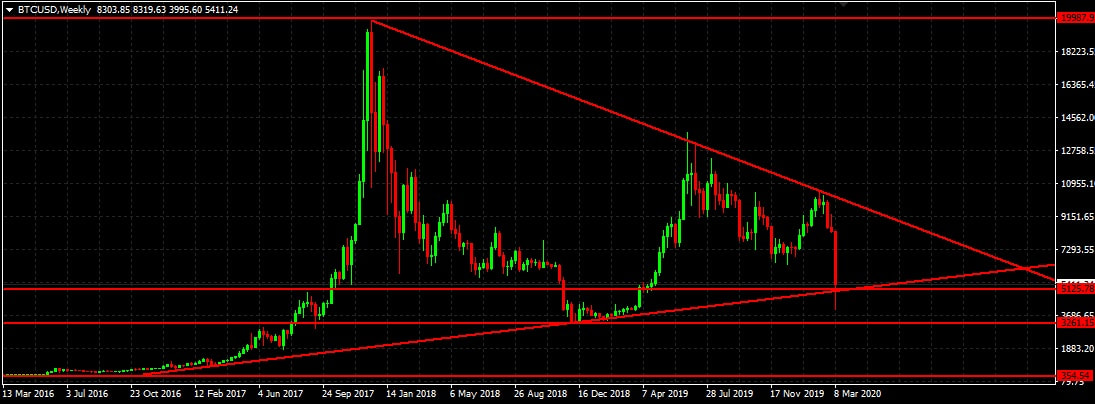
As per the BTCUSD weekly chart, we can observe that the BTCUSD is trading near its major support and back from its support levels. We are expecting the BTCUSD to appreciate further from its current levels and to remain range bound in between 3261 and 10538 levels. We are expecting strong pull back from 5125 levels. The major and important resistance seems to be around 9410 and 10538 levels, where we may see some selling pressure again. Breakout below 3261 levels may trigger further selling pressure and breakout above 11470 may create buying pressure. Any breakouts of support or resistance levels are important as breakouts may trigger further movement in the same direction.
Major Support and Resistance:
Resistance: 6320, 7791, 9410, 10538, 11470, 13921, 17165
Support: 5125, 3261, 2990, 1933, 876
Trading with proper stop loss (may be in between 30-50 points) depending upon the volatility will limit the trade risk exposure. Any trigger of stop indicates further revision of strategies as stop loss trigger can drag the prices further in the same direction of stop loss or a change in price direction. So one should be careful and should watch the prices for some time before taking any decision on such events.
 RSS Feed
