USDCAD Technical Analysis Report for the Month Ahead – 12-08-2018
Weekly Chart (1.3128)
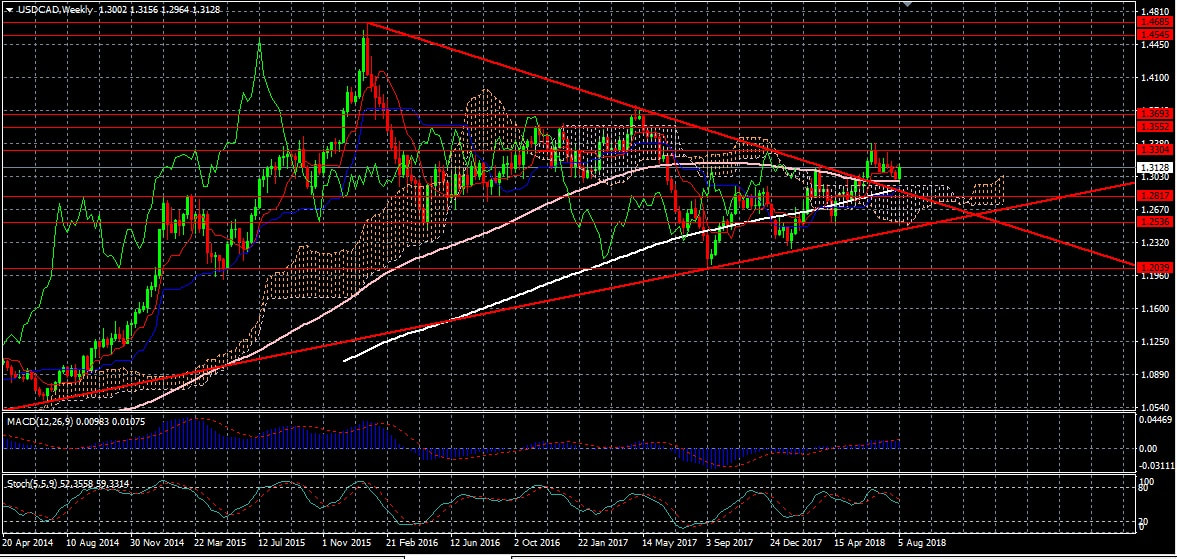
Here we have weekly candle stick chart of USDCAD and as per the chart we can notice that the currency pair has broken and trading above its medium term downward trend. The pair is also trading above its long term moving average. And as per the Ichimoku indicator the currency pair is trading above the cloud.
So as per our analysis and technical indicators, we are expecting the currency pair to appreciate further from its current trading levels of 1.3128. USDCAD is having major support at 1.2986, 1.2960, 1.2895, 1.2817, 1.2673, 1.2527 and 1.2441. The currency pair is having major resistance at 1.3304, 1.3552, 1.3693, 1.3813 and 1.3953 levels. Any breakout below 1.2527 and 1.2441 levels may trigger further significant downward movement to 1.2039 and 1.1212 levels. Any breakouts of support or resistance levels are important as breakouts may trigger further movement in the same direction.
Major Support and Resistance:
Resistance: 1.3304, 1.3552, 1.3693, 1.3813, 1.3953, 1.4168, 1.4545
Support: 1.3103, 1.2986, 1.2960, 1.2895, 1.2817, 1.2673, 1.2527, 1.2441, 1.2039, 1.1212
So as per the technical analysis, the ideal strategy for trading USDCAD in the next few days should be:
Buying at 1.2986 with a Stop at 1.2950, Target at 1.3304 and 1.3552 levels.
Selling below 1.2950 levels with a Stop at 30 pips and Target at 1.2817.
Buying at 1.2817 with a Stop at 1.2779 and Target at 1.2986, 1.3103 and 1.3304 levels.
Selling below 1.2780, Stop at 35 pips, Target at 1.2673, 1.2536 and 1.2441.
Buying above 1.2536, Stop at 1.2500 and Target at 1.2673, 1.2817, 1.2986, 1.3103, 1.3304, 1.3552 and 1.3693.
Buying above 1.3304, Stop at 35 pips and Target at 1.3552, 1.3693, 1.3813, 1.3953 and 1.4168.
Any trigger of stop indicates further revision of strategies as stop loss trigger can drag the prices further in the same direction of stop loss or a change in price direction. So one should be careful and should watch the prices for some time before taking any decision on such events.


 RSS Feed
