USDCAD Technical Analysis Report – 21-06-2020
Weekly Chart (1.3606)
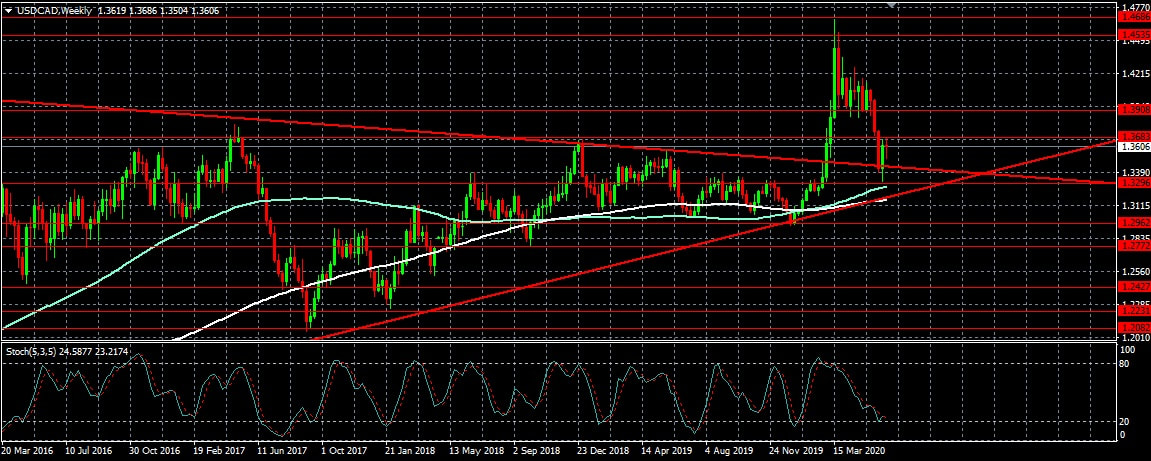
Here we have weekly USDCAD and from this chart we can notice that it has mostly corrected its recent appreciation. The currency pair is trading in an upward trend and as we can notice the recent breakout. As per moving averages, the short term moving average has crossed above long term moving average and the prices are trading near its long term average. The pair is having support near 1.3420 and 1.3296 levels. And resistance lies near 1.3683 and 1.3908 levels.
As per our analysis, we are expecting USDCAD to appreciate from its current levels to 1.4183 and 1.4535 levels in the next few days. Price near 1.3420 and 1.3296 levels or any move above 1.3683 levels may create significant buying pressure. Any fall below 1.2962 levels may create selling pressure for the currency pair. Range bound area may remain in between 1.3296 level and 1.2962 level.
Major Support and Resistance:
Resistance: 1.3683, 1.3908, 1.4183, 1.4535, 1.4686, 1.4950
Support: 1.3420, 1.3296, 1.3194, 1.3035, 1.2962, 1.2772, 1.2427, 1.2231
Trading with proper stop loss (may be in between 30-50 pips) depending upon the volatility will limit the trade risk exposure. Any trigger of stop indicates further revision of strategies as stop loss trigger can drag the prices further in the same direction of stop loss or a change in price direction. So one should be careful and should watch the prices for some time before taking any decision on such events.
 RSS Feed
