S&P 500 Technical Analysis Report – 07-09-2020
Weekly Chart (3427)
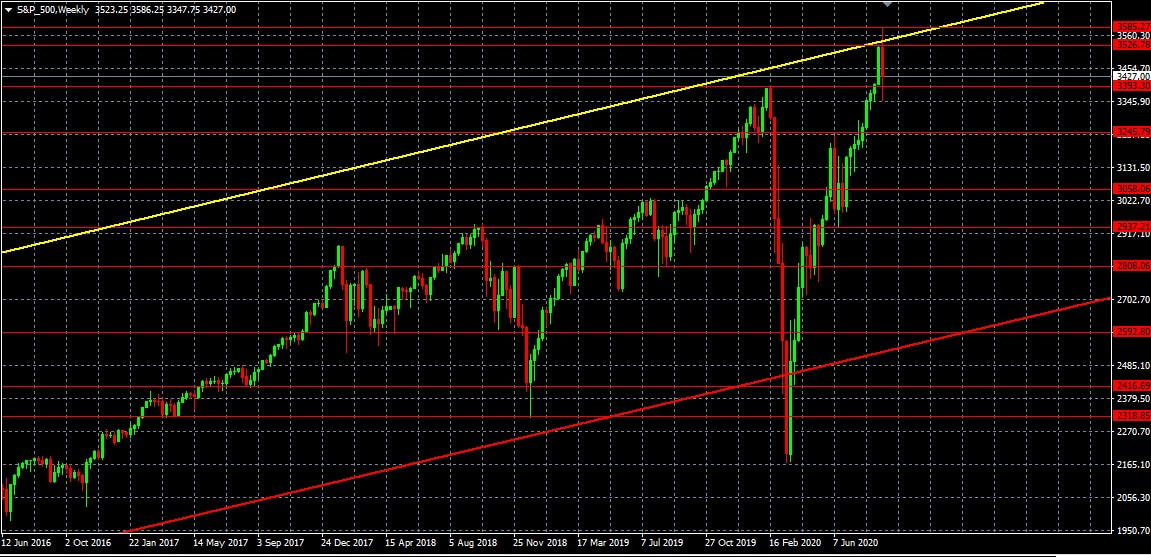
HISTORICAL PRICE ACTION ANALYSIS
Short Term Trend: Upward
Long Term Trend: Upward
Range: 2168 to 3585
Resistance: 3526, 3559, 3585, 3679
Support: 3393, 3218, 3023, 2937, 2808, 2592
Movement in the past few weeks: Upward
Movement in the past few days: Upward
EXPECTED FUTURE PRICE ACTION
Reversal Expected/ Correction: Chances are high
Expected movement in the next few days: Downward
Expected Short Term Trend: Downward
Expected Range: 3559 to 2553
Trading with proper stop loss (may be in between 50-70 points) depending upon the volatility will limit the trade risk exposure. Any trigger of stop indicates further revision of strategies as stop loss trigger can drag the prices further in the same direction of stop loss or a change in price direction. So one should be careful and should watch the prices for some time before taking any decision on such events.
Any breakout below support levels may create significant selling pressure that may drag the prices to its next support level. Any breakout above resistance levels may create short term buying pressure that may allow prices to appreciate further to its next resistance level.
 RSS Feed
