Reliance Industries(RIL) Technical Analysis Report – 23-06-2020
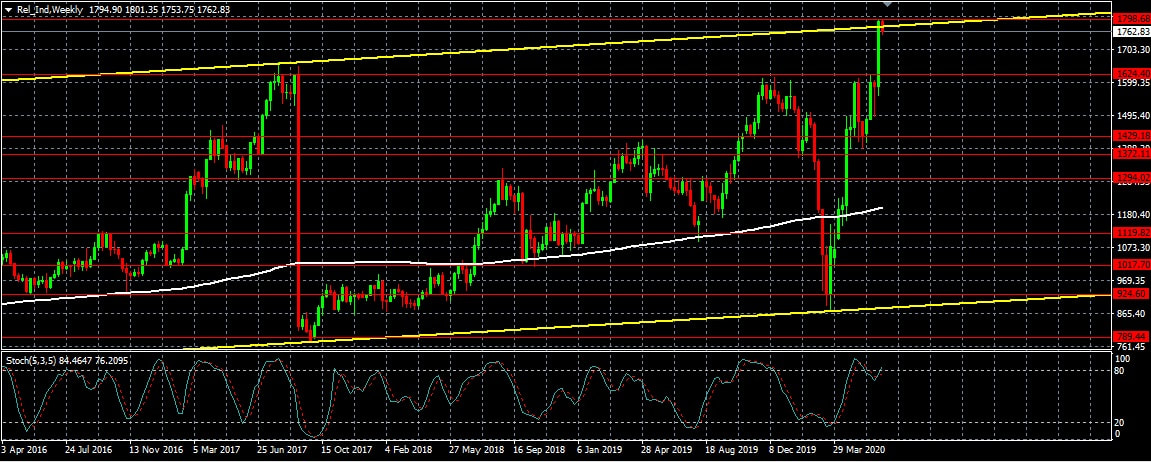
Weekly Chart (1762.83)
Recently there is a lot of buzz around Reliance Industries due to multiple Reliance Jio stake deals. The company is fundamentally strong and with all its resources, it does hold much potential for future growth in its respective businesses. Keeping Indian market size in mind, if everything goes well and as planned, down the 10 years it looks promising. However, we don’t know where this company will stand at that point of time but it seems like much of the current developments are hypothetical and based on assumptions.
Here we have Reliance Industries weekly chart and we can notice its sharp and quick appreciation from its recent bottom. Currently RIL is trading near its all time high due to its current Jio deals despite our current economic and market conditions. It seems like company’s management is strong and doing well. This is market and such movements are expected from time to time in highly liquid and high volume stocks.
As per Technical Analysis, we are expecting prices to cool down a little bit and may have some corrections from its current levels in the near to medium term. RIL is trading near its resistance of 1780 and 1799 levels and its support is around 1624 levels. As per technical analysis, the stock is trading in a upward channel and already touched its upper trend line of the channel. So, we are expecting it to depreciate from its current levels and any move below 1624 levels may drag the prices further to 1294 levels. Any fall below 1294 levels may create significant selling pressure that may drag the Index further to 924 levels. Any breakout above 1800 levels may create short term buying pressure that may cause RIL to appreciate further but chances are that it may correct very quickly and any such opportunity may be good for intraday trading purpose only. Range bound area for the stock may be in between 1799 and 1624 levels.
Major Support and Resistance:
Resistance: 1780, 1799
Support: 1624, 1429, 1372, 1294, 1119, 1017, 924, 882, 777
Trading with proper stop loss (may be in between 50-60 points) depending upon the volatility will limit the trade risk exposure. Any trigger of stop indicates further revision of strategies as stop loss trigger can drag the prices further in the same direction of stop loss or a change in price direction. So one should be careful and should watch the prices for some time before taking any decision on such events.


 RSS Feed
