GBPUSD Technical Analysis Report for the Week Ahead – 08/10/2017
Daily Chart (1.3061)
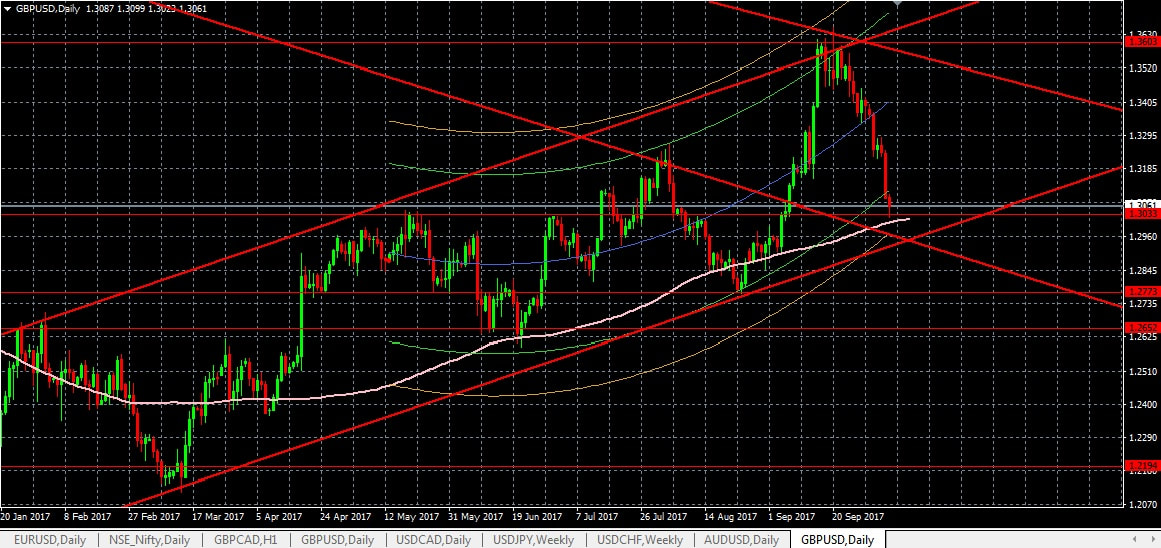
It’s the continuation of the previous GBPUSD report. As per the daily GBPUSD chart, we can observe that the currency pair is trading near its support and near its lower trend line. The currency pair is also trading near its long term moving average and lower CG channel providing major support to the currency pair at the current price levels. So, purely on the basis of technical analysis, we are expecting this currency pair to appreciate from its current levels in the next few days.
Resistance: 1.3267, 1.3603, 1.3636, 1.3834, 1.3990, 1.4055, 1.4552
Support: 1.3033, 1.2960, 1.2773, 1.2652, 1.2194, 1.2134
As per the technical analysis our strategy for the next week should be:
Buy at 1.3025, Stop at 1.2990 and Target at 1.3267, 1.3603, 1.3640
Buy at 1.2960, Stop at 1.2925 and Target at 1.3033, 1.3267, 1.3603, 1.3640
Sell below 1.2920, Stop at 1.2955 and Target at 1.2773, 1.2652, 1.2194, 1.2135
Buy at 1.2650, Stop at 1.2615 and Target at 1.2773, 1.2960, 1.3033, 1.3267, 1.3603
Sell below 1.2615, Stop at 1.2655 and Target at 1.2194, 1.2135


 RSS Feed
