EURUSD Technical Analysis Report for the Week Ahead – 05/11/2017
Daily Chart (1.1608)
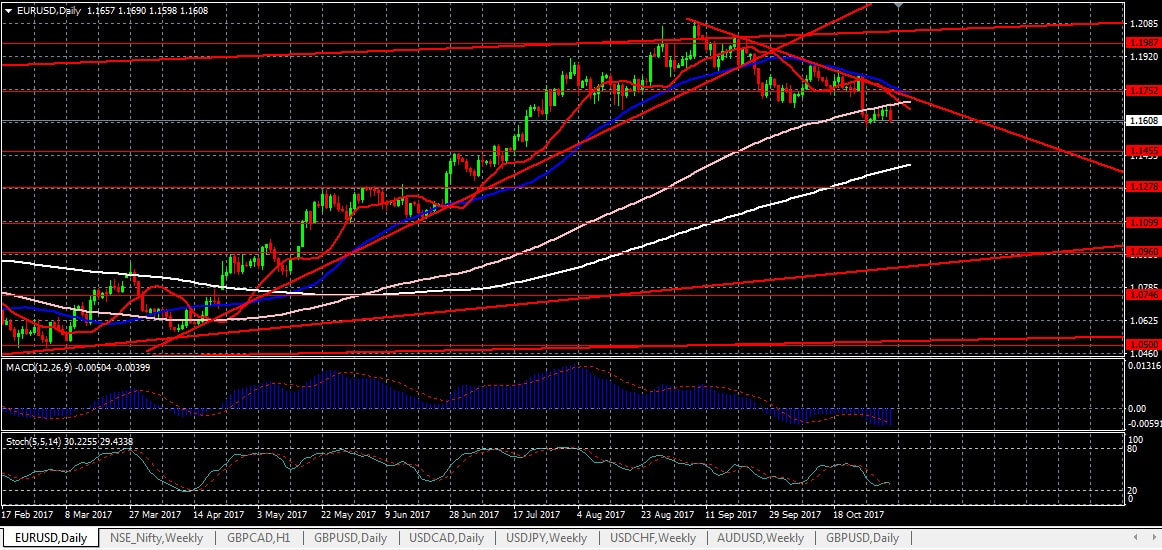
As per the daily chart of EURUSD, we can observe that the currency pair is moving in a downward trend and trading below its long term moving average which is also acting as a major resistance. As per the price movement and other technical indicators of this currency pair, we are expecting this currency pair to further depreciate from its current levels in the next few days. We are expecting EURUSD to have strong resistance at 1.1690 levels and may act as best selling price.
So the strategy for trading this pair should be shorting the EURUSD pair at 1.1690 levels and covering positions near 1.0960 levels and again start buying around 1.0960 levels.
Resistance: 1.1690, 1.1752, 1.1880, 1.1987, 1.2072, 1.2182, 1.2305
Support: 1.1455, 1.1385, 1.1278, 1.1099, 1.0960, 1.0746, 1.0577, 1.0500
As per the technical analysis our strategy for the next few days should be:
Sell at 1.1610, Stop at 1.1645, Target at 1.1455, 1.1385, 1.1278, 1.1099
Sell at or below 1.1690 and Buy above 1.1752; Stop-Loss: 35 pips; Target: As per Support and Resistance levels
 RSS Feed
