NIFTY Technical Analysis Report – 13-05-2019
Weekly Chart (11274)
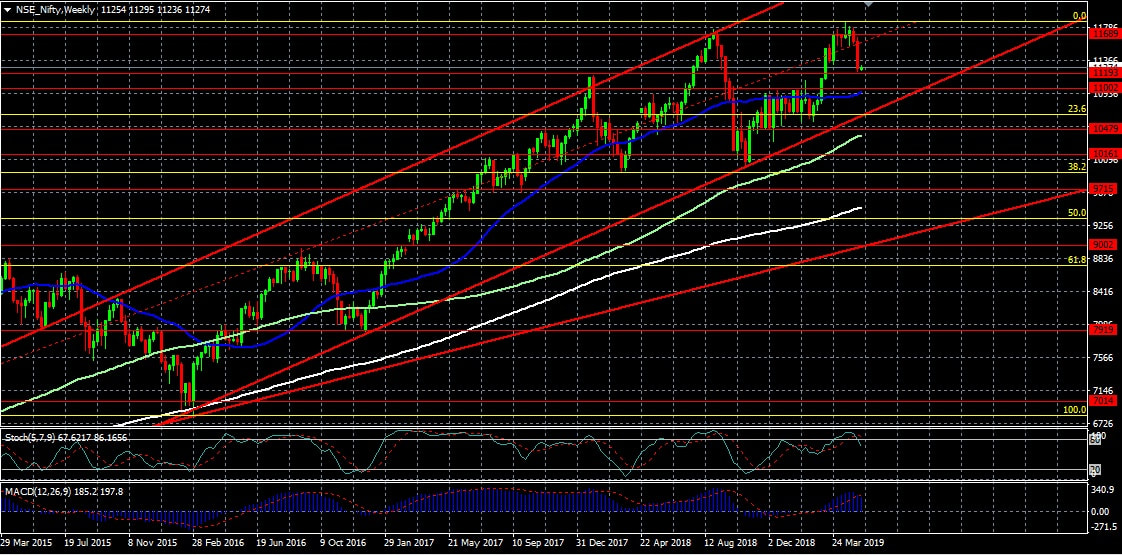
Here we have weekly chart for Nifty and we can notice that the Nifty is moving in an upward trend for the last three years with small corrections in-between which created opportunities for traders to reinvest in lower levels.
As per the chart, Nifty is current trading near its short term support of 11193 and in the next few days we are expecting Nifty to break below this level due to uncertainty around current ongoing election outcomes and may take support at 10670. The event is of high importance creating higher volatility in the market and can move the market drastically in either direction. So as per our analysis and technical indicators, we are expecting Nifty to bounce back from 10670 and 10479 levels if the election outcome is interpreted positively by the markets. In case of negative interpretation and break below 10479 may create room for further downward movement. Any breakout below 10479 may drag the Nifty to 9346 and 8994 levels. We may expect some bounce back in Nifty from 8994 and 8739 levels and may again start appreciating from there. Reducing the risk exposure and leverage or using options before the election outcome may be a good idea. Any breakouts of support or resistance levels are important as breakouts may trigger further movement in the same direction to its next support or resistance level.
Major Support and Resistance:
Resistance: 11558, 11689, 11854 and 12572
Support: 11193, 11002, 10670, 10479, 10161, 9932, 9715, 9346, 8994, 8739 and 7909
Trading with proper stop loss (may be in between 30-50 points) is a must to limit the trade risk exposure. Any trigger of stop indicates further revision of strategies as stop loss trigger can drag the prices further in the same direction of stop loss or a change in price direction. So one should be careful and should watch the prices for some time before taking any decision on such events.
 RSS Feed
